Connecting to ParaView
5. Sign In to the SSH terminal
When you click the OK button in the Connection Options dialog, modelbuilder opens a terminal for logging into NERSC. Sign in by entering your user-password followed by a one-time-password (OTP). This creates an ssh tunnel to the remote system and submits a job to the queuing system to launch a ParaView server.

After you sign in, a script is executed to submit the job request for ParaView server.

Important
The SSH window needs to stay open while using ParaView for remote visualization.
6. Load the SLACTools Plugins
This job request might be executed immmedately or might remain queued for some time. Once execution begins, software on the server (NERSC) will connect back to modelbuilder. When this happens, modelbuilder displays the Plugin Manager dialog with two columns for remote plugins and local plugins, respectively. Use the Plugin Manager to select and load the SLACTools plugin in both local columns. (A Wating for Server Connection dialog is displayed on top of the Plugin Manager, however, it does not prevent selecting and loading the SLACTools plugins.) After the SLACTools plugins are loaded, close the Plugin Manager.

7. Select Mode Files
When the Plugin Manager is closed, modelbuilder will display a Mode Select dialog (the same one used for local visualization).

Select any of the files in the list and click the dialog OK button. ModelBuilder will then connect to the ParaView server at NERSC to construct and execute the visualization pipeline and begin delivering geometry or imagery to modelbuilder.
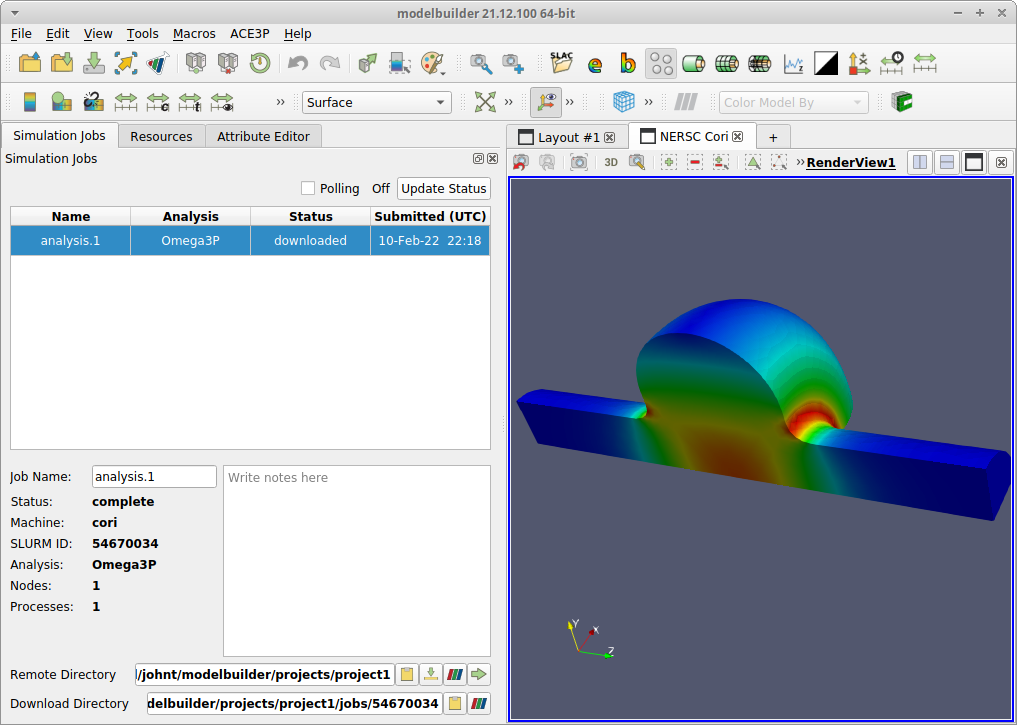
8. Display the Data
When visualization data are received from the NERSC ParaView server, they are displayed in a second tab that modelbuilder adds to the rendering area. You can explore the data using the ParaView and SLACTools features described in the Omega3P example. By default, ModelBuilder for ACE3P hides the ParaView pipeline inspector and related toolbars and filters. To see them, find and click the  (gray ParaView) toolbar button. When clicked, the button will change to the familiar red-green-blue ParaView logo, the Pipeline Browser will be displayed in the sidebar, and several additional ParaView toolbars will be displayed. In the View menu, you can also enable the Properties view to adjust a broad range of display details.