Viewing Omega3P Results
With the computed results downloaded to the local filesystem, you can use the interactive ParaView features to construct visualization pipelines and display the data.
12. Display the Results Data
When the results data files were downloaded in the previous step, a ParaView tool button was enabled in the job details widget.

Click on that tool button now to display data in a new render view. ModelBuilder first opens a popup dialog listing the mode files that were downloaded for this job.

Select any of the files in the list and click the dialog OK button. ModelBuilder will then load that data and display it in a new render view. With the new view selected (active), you can use the render view Maximize button to fill the viewport.

You can also close the Output Messages view to make more space for viewing the results.

13. Load SLACTools Plugin
With the results data loaded, you can also use the SLACTools plugin to select from a set of standard display features for ACE3P datasets. To load the SLACTools toolbar, open the Tools menu and select the Manage Plugins… item to open the Plugin Manager dialog. Find and click on the SLACTools item in the dialog and then click the Load Selected button.
14. Enable ParaView Features
By default, ModelBuilder for ACE3P hides the ParaView pipeline inspector and related toolbars and filters. To see them, find and click the toolbar button with a gray ParaView icon. Once clicked, the button will change to display the familiar red-green-blue logo, the Pipeline Browser will be displayed in the sidebar, and several additional ParaView toolbars will be displayed.

15. Show Properties View
In the View menu, enable the Properties item. You can arrange the views as you like, and close those you no longer need.
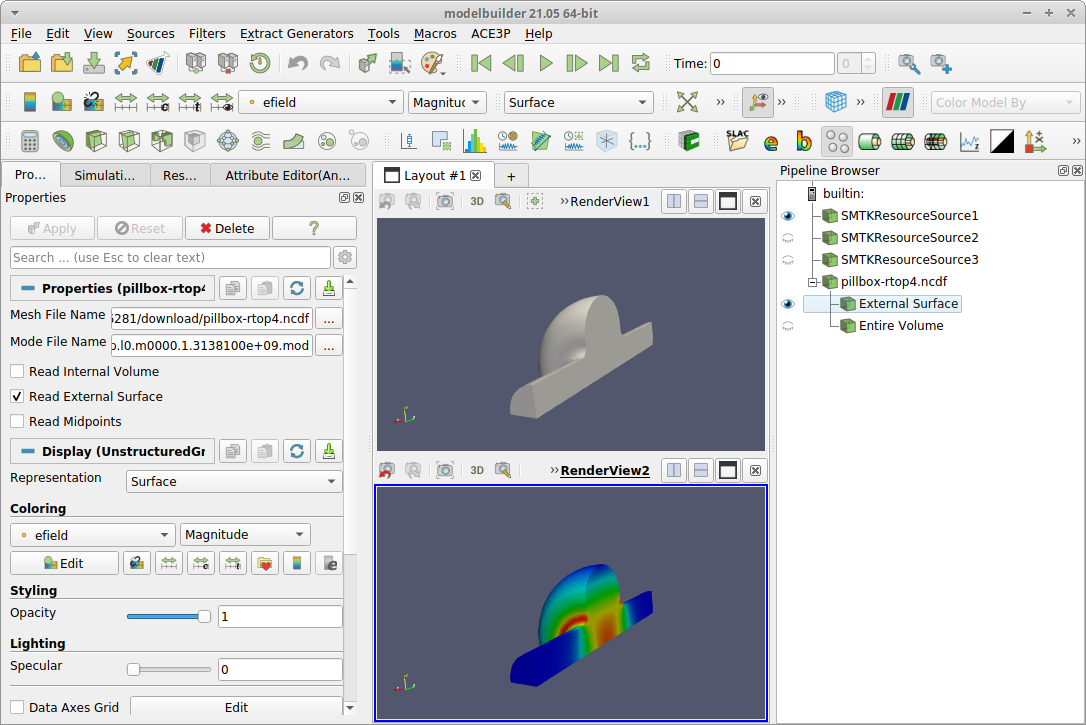
At this point, you can use all of the ParaView and SLACTools features to visualize your project data including the fields generated by the Omega3P simulation. Here is an example with vertically-stacked render views of the input geometry and results data, using a common (linked) camera view point. The Properties View is docked with other tabs in the left sidebar and the Pipeline Browser docked as the right-hand sidebar.